The etch rate experiment presented by Myers and Montgomery in their textbook Response Surface Methodology: Process and Product Optimization Using Designed Experiments (2nd edition, 2002) is a widely cited case study in the application of response surface methodology (RSM) to industrial process optimisation. It investigates how two controllable process factors affect the etch rate in a plasma etching system — a critical step in semiconductor manufacturing.
Background
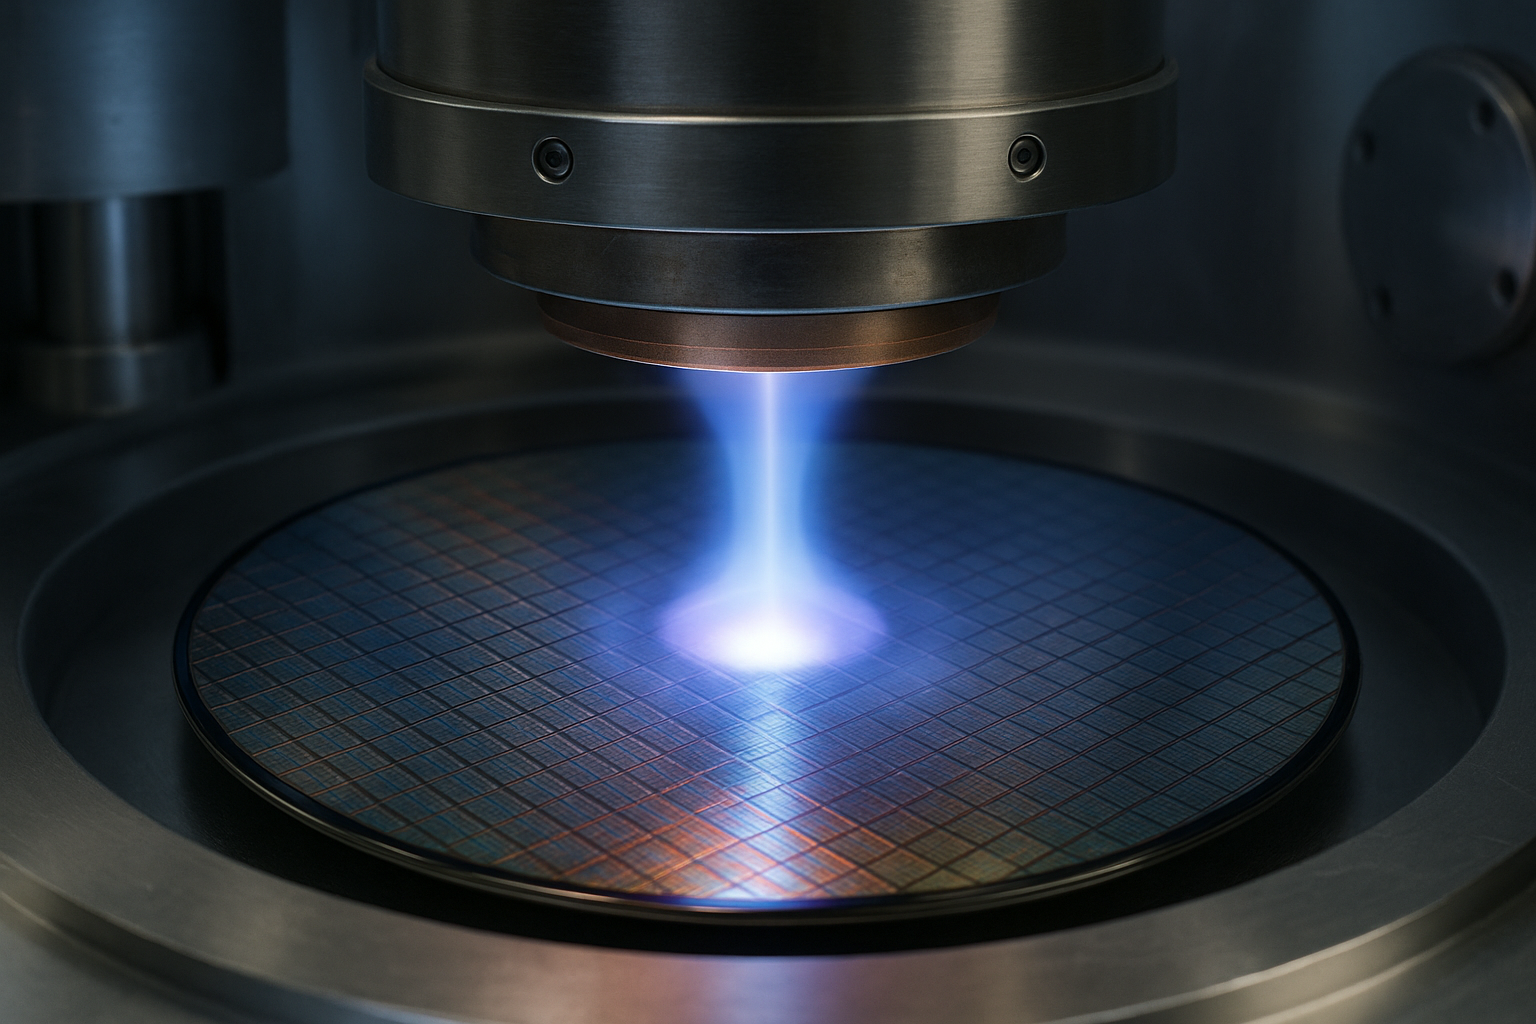
In this context, plasma etching removes material from the surface of a silicon wafer. The aim of the experiment was to determine how changes in two process variables — RF power and chamber pressure — influence the etch rate.
The input variables were:
: RF power (watts)
: Chamber pressure (torr)
The response variable was:
: Etch rate (angstroms per minute, Å/min)
Experimental Design
A central composite design (CCD) was selected to estimate a second-order model, allowing the detection of curvature in the response surface.
The design included:
- Full factorial design:
runs
- Four axial (star) points at
- Five centre points for estimating pure error and testing lack-of-fit

In total, 13 runs were performed. All factor levels were coded as follows:
- Coded low level:
- Coded centre level:
- Coded high level:
- Axial (star) points:


Model Specification
A full second-order model was fitted to the data:

Where:
- Intercept:
- Linear effects:
- Quadratic effects:
- Interaction term:
- Random error:


Experimental Results
The fitted regression model was:

This result suggests:
- Increasing
(power) has a strong positive effect on the etch rate
- Increasing
(pressure) also increases etch rate, but to a lesser extent
- The negative coefficients on
and
indicate curvature in both directions
- The interaction between power and pressure is slightly synergistic:

Optimisation
To locate the stationary point (maximum), the partial derivatives were set to zero:


Solving this system gives:

Substituting these into the model:


Visualisation
The response surface is curved and bowl-shaped, with a distinct interior maximum. Contour and surface plots would show elliptical contours centred near 
Conclusion
This experiment demonstrates a textbook application of RSM in engineering process development. It illustrates:
- The use of CCD to fit a quadratic model with minimal runs

- How to interpret curvature and interactions in coded models
- The analytical determination of optimal process settings using calculus
It remains one of the most widely taught examples of experimental design in physical sciences and manufacturing engineering.
For more information about our experimental design and general development services see: Development Services.
For a more detailed overview of experimental design see: Experimental Design.
Or, as an alternative, consider this: DoE Overview