Design of Experiments (DoE) is a structured, statistical methodology used to plan, conduct, analyse, and interpret controlled tests to evaluate the factors that may influence a particular outcome or process.

It is widely used in engineering, manufacturing, scientific research, and quality improvement. Read more about how DoE fits in to our portfolio of developmental activities here: Development Services.
🔧 In Simple Terms:
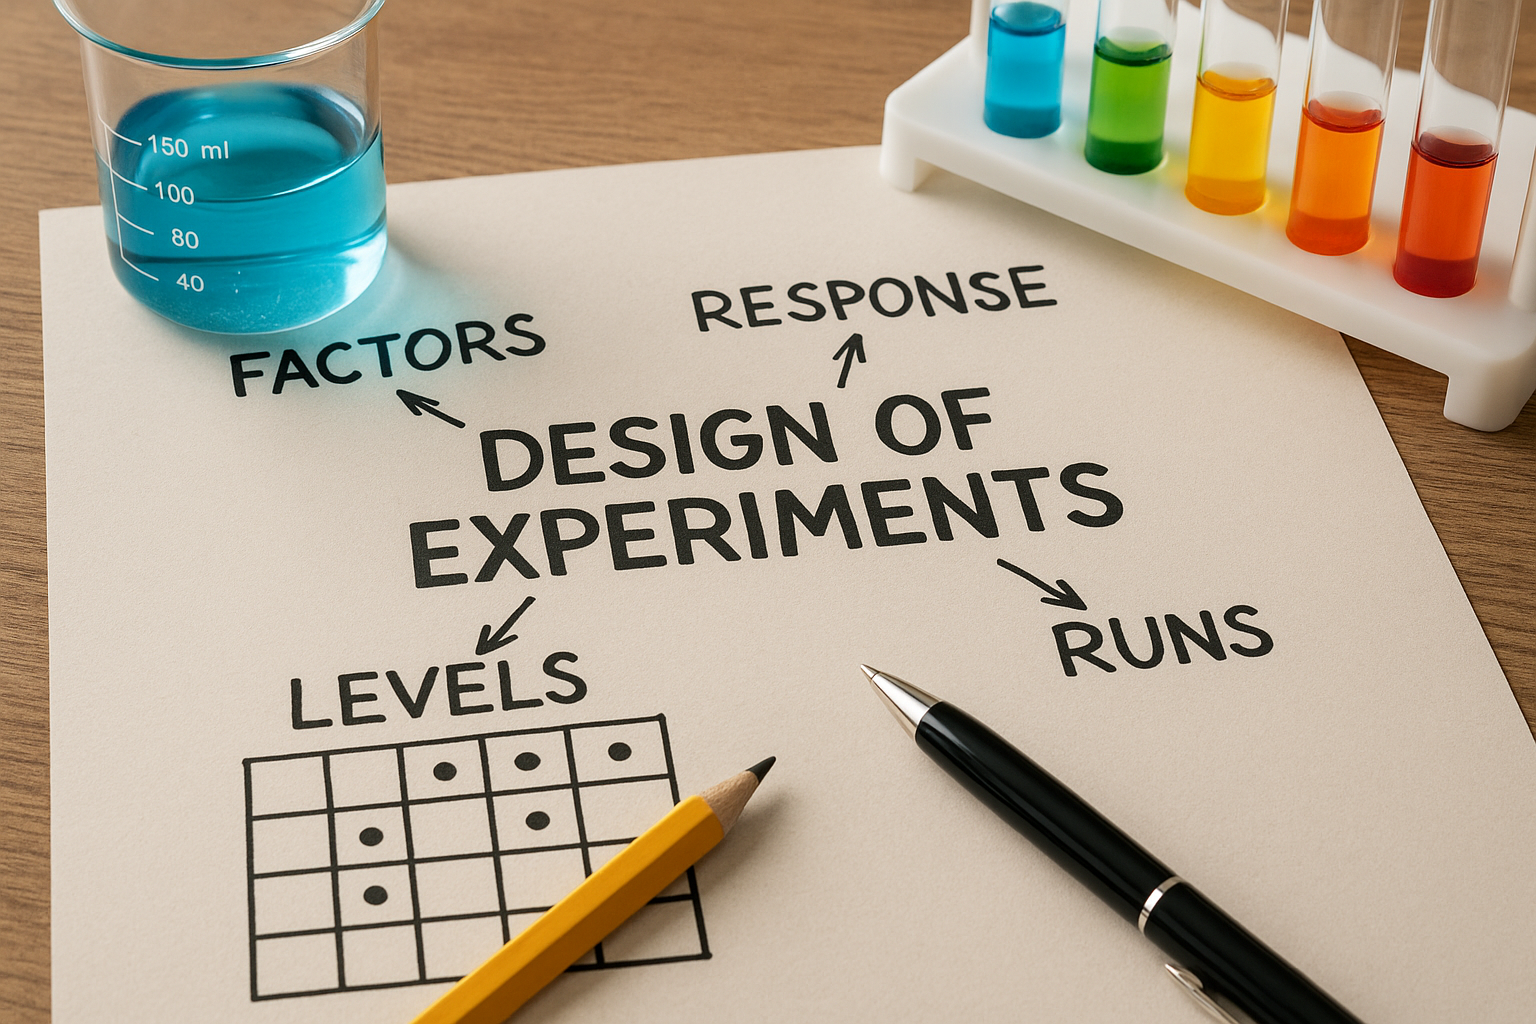
Design of Experiments helps you determine which inputs (factors) have the most significant effect on an output (response) — and how to optimise that output through systematic testing rather than trial and error.
📌 Core Principles
- Factors: Inputs or variables you can control (e.g. temperature, pressure, speed).
- Levels: The values at which you test each factor (e.g. high/low or several steps).
- Responses: The outcomes you measure (e.g. strength, yield, surface finish).
- Interactions: When two or more factors affect the response jointly.
- Replication: Repeating tests to estimate variability and improve confidence.
- Randomisation: Running trials in a random order to reduce bias.
- Blocking: Grouping similar experimental conditions to reduce noise from uncontrolled variables.
🧪 Example Use Case (Engineering)
Suppose you are optimising the surface finish of a machined part.

Factors may include:
- Cutting speed
- Feed rate
- Tool type
Using DoE, you would plan a matrix of experiments that varies these factors systematically, rather than changing one at a time, allowing you to:
- Quantify main effects and interactions
- Model the process mathematically
- Find the optimal settings
📈 Common DoE Methods
| DoE Type | Description | Use Case |
|---|---|---|
| Full Factorial | Tests all combinations of all factors and levels | Small experiments with few factors |
| Fractional Factorial | Uses a subset of combinations to reduce cost/time | Screening large numbers of factors |
| Taguchi Methods | Emphasises robustness against variation | Process control and reliability |
| Response Surface Methodology (RSM) | Fits a surface to explore optima | Precise optimisation after screening |
| Mixture Designs | Used when factors are proportions (sum to 100%) | Formulation problems (e.g. polymers, fuels) |
✅ Benefits
- Faster and cheaper than one-factor-at-a-time testing
- Reveals interactions and nonlinearities
- Improves process understanding and control
- Leads to better quality and reliability
📚 Related Concepts
- ANOVA (Analysis of Variance)
- Regression modelling
- Statistical process control (SPC)
- Six Sigma
✅ When Are Full Factorial Designs Generally Used?
Full Factorial Designs are applied when you want to investigate all possible combinations of factor levels to:
- Fully understand main effects and interactions
- Develop accurate, predictive models
- Avoid missing important relationships between variables
🔬 1. Early-Stage Product or Process Understanding
Ideal when you’re uncertain how different factors influence a response and want to evaluate all interactions.
- Example: Studying the influence of temperature, pressure, and dwell time on adhesive bond strength.
🧪 2. Small Number of Factors (Typically ≤ 4)
The number of runs increases exponentially with the number of factors. For a design with 

- For
:
runs
- For
:
runs
- For
:
runs (still manageable)
🧯 3. When Factor Interactions Are Important
Full factorials detect all main effects, two-factor, and higher-order interactions.
- Example: In chemical processes, the effect of
may depend on
— a two-factor interaction.
📏 4. For Calibration or Precise Modelling
Full factorials provide a robust data set for:
- Regression modelling
- Response prediction
- Understanding linear and interaction effects
✅ 5. Verification or Validation Studies
Used to validate critical systems where all combinations of settings must be evaluated to ensure performance or compliance.
🚫 When Not to Use Full Factorial Designs
| Situation | Recommended Alternative |
|---|---|
 | Fractional Factorial or Screening Design |
| Limited time/resources | Taguchi or Plackett-Burman Design |
| Curved/nonlinear responses | Response Surface Methodology (RSM) |
| Mixture components | Mixture Designs (e.g., Simplex Centroid) |
🔁 Summary – Full Factorial designs
Use full factorial designs when:
- You have
factors
- All main effects and interactions matter
- You need detailed models or high-resolution results
- You can afford the time and cost of a full test matrix
✅ When Are Fractional Factorial Designs Generally Used?
Fractional Factorial Designs are used when you want to study many factors efficiently, without testing all possible combinations. They let you:
- Screen important factors quickly
- Reduce the number of experiments
- Still estimate main effects and selected interactions
These designs are ideal when resources are limited or only a subset of effects are expected to be significant.
🧪 1. Large Number of Factors (Typically  )
)
The number of runs in a full factorial grows exponentially:
For 

For 

A fractional factorial design (e.g. 

🔍 2. Factor Screening Studies
Use fractional designs to identify the most influential factors from a larger pool.
- Example: A design team investigates 7 factors affecting injection moulding quality using a
run design.
⚠️ 3. When Higher-Order Interactions Are Negligible
Fractional designs assume that three-way and higher interactions are insignificant — so these can be aliased (confounded) with main effects or two-way interactions.
- This trade-off is acceptable in early-stage experiments or when domain knowledge supports the assumption.
💡 4. Efficient Experimentation with Limited Resources
Ideal for:
- Academic research with limited test time
- Prototyping phases
- Early process development
They provide actionable insight while controlling costs.
🧠 How They Work: Resolution Concept
Fractional designs are classified by resolution, which defines what effects are aliased:
| Resolution | Meaning |
|---|---|
 | Main effects may be aliased with two-factor interactions |
 | Main effects clear of two-factor interactions; two-factors may be aliased with each other |
 | Main and two-factor effects are unconfounded; suitable for detailed modelling |
Higher resolution = less aliasing = more reliable effect estimates.
🚫 When Not to Use Fractional Factorial Designs
| Situation | Use Instead |
|---|---|
 and cost is not prohibitive and cost is not prohibitive | Full Factorial |
| High-order interactions are important | Full or Augmented Design |
| Model curvature is expected | Response Surface Methodology (RSM) |
| Strong regulatory/validation needs | Full Factorial or Central Composite Design |
🔁 Summary – Fractional Factorial designs
Use fractional factorial designs when:
- You need to evaluate
- Only main effects and low-order interactions are important
- You want to screen variables before optimisation
- You have resource or time constraints
- Some aliasing is acceptable for the problem stage
✅ When Are Taguchi Designs Generally Used?
Taguchi Designs are used when the goal is to improve robustness and optimise quality, especially in manufacturing and product design.

They focus on identifying control factor settings that minimise variation due to noise factors (i.e. uncontrollable external conditions).
🧰 1. When You Want to Improve Robustness
Taguchi designs are ideal when the priority is not just optimising the mean response, but also reducing variability and making the system insensitive to external disturbances.
- Example: Designing a car seat adjuster that works consistently across temperature extremes, voltage fluctuations, and wear.
📉 2. When Signal-to-Noise Ratio Matters
Instead of just analysing the response mean, Taguchi methods use signal-to-noise (S/N) ratios to quantify robustness:
- Higher S/N = More Robust Performance
Common S/N formulations:
- “Larger-the-better”:
- “Smaller-the-better”:
- “Nominal-the-best”:


🧪 3. When You Have Many Factors and Limited Runs
Taguchi designs use orthogonal arrays (OAs) to test many factors with a small number of experiments.
- Example:
array → 4 factors at 3 levels in just 9 runs
- Example:
array → up to 15 factors at 2 levels in 16 runs
These arrays maintain balance and orthogonality, ensuring that factor effects are statistically independent.
🧬 4. When You Can Distinguish Control vs. Noise Factors
Taguchi’s outer-inner array strategy allows you to:
- Test control factors in the inner array
- Simulate real-world variation via noise factors in the outer array
This method is central to Robust Parameter Design.
🛠️ 5. When You Want a Simplified Yet Structured Approach
Taguchi methods are often used in:
- Six Sigma DMAIC projects
- Lean manufacturing environments
- Industrial R&D
They are easier to apply than full regression modelling, making them accessible to teams with limited statistical training.
🚫 When Not to Use Taguchi Designs
| Situation | Use Instead |
|---|---|
| You need detailed interaction modelling | Full or Fractional Factorial |
| You need to model nonlinear curvature | Response Surface Methodology (RSM) |
| You require regression-based predictive models | RSM or DOE regression |
| You must estimate all two-way interactions independently | Factorial Designs with Resolution V |
🔁 Summary – Taguchi designs
Use Taguchi designs when:
- You want to optimise robustness and reduce variability
- You need a small, structured design with many factors
- You want to improve quality and consistency
- You’re focused on practical industrial optimisation
- You’re using S/N ratios to measure performance quality
✅ When Are Response Surface Methodology (RSM) Designs Generally Used?
Response Surface Methodology (RSM) is used when you want to optimise a process or refine a model after key factors have been identified.

RSM explores curvature in the response surface, allowing you to find maximum, minimum, or target values of the response.
🧪 1. When the System is Nonlinear
RSM assumes that the response depends on factors through a curved surface — typically modelled as a second-order (quadratic) polynomial:

: coded input variables
: predicted response
: curvature (quadratic) terms
: interaction terms
📈 2. When Optimising a Response
RSM is ideal for locating:
- Peaks (maximum output)
- Valleys (minimum cost, error, etc.)
- Stationary points (e.g., product meets a target specification)
🧰 3. After Screening is Complete
RSM is typically applied after a screening design, like a fractional factorial, has identified the important factors. These are then studied in more depth using RSM.
🧮 4. When You Want to Fit a Predictive Model
RSM allows you to construct accurate regression-based models that can:
- Predict response for any setting within the factor region
- Explore interactions and curvature
- Support multi-objective trade-offs
📊 Common RSM Designs
| Design | Description | Number of Levels |
|---|---|---|
| Central Composite Design (CCD): see here | Augments a factorial with centre and axial points | 5 levels |
| Box-Behnken Design (BBD): see here | Balanced design using midpoints of edges | 3 levels |
| Face-Centered CCD (CCF) | A practical alternative with axial points on cube faces | 3 levels |
🧬 5. When You Want Model-Based Optimisation Tools
RSM enables advanced tools like:
- Contour plots and 3D surface plots
- Canonical analysis of stationary points
- Desirability functions for multi-response optimisation
🚫 When Not to Use RSM
| Situation | Better Alternative |
|---|---|
| Many unknown or unimportant factors | Start with a screening design (e.g., fractional factorial) |
| High-order nonlinearities (> quadratic) | Use neural nets or machine learning approaches |
| Few factors and no curvature expected | Use full factorial or Taguchi designs |
| Response is binary or categorical | Use logistic regression or classification models |
🔁 Summary – RSM designs
Use RSM designs when:
- You’ve already identified key factors (
)
- The response surface is curved
- You want to optimise or refine a product or process
- You need accurate, interpretable models
- You’re seeking the best combination of inputs for performance
✅ When Are Mixture Designs Generally Used?
Mixture Designs are used when the factors are components of a mixture, and their proportions — rather than absolute amounts — affect the response. A key constraint is that the sum of all component proportions must equal 1 (or 100%).
🧪 1. When Inputs Are Proportional and Constrained
In a mixture experiment, the variables represent fractions or percentages of components. Thus, the defining constraint is:

Where:
: proportion of the ithi^\text{th}ith component
: number of mixture components
This constraint introduces dependency between variables — increasing one component must decrease at least one other.
🧬 2. When the Product is a Blend or Formulation
Common in:
- Food science (e.g. proportions of fat, sugar, protein)
- Pharmaceuticals (e.g. excipient mixtures)
- Polymers and composite materials
- Paints, lubricants, fuels, adhesives
Example: Optimising a fuel blend with components A, B, and C such that

📐 3. When Factorial or RSM Designs Are Inappropriate
Traditional factorial or response surface designs do not respect the constraint 
Mixture designs ensure all experimental runs fall within the feasible simplex (i.e. inside the triangle, tetrahedron, etc. of valid mixtures).
📊 Common Mixture Design Types
| Design | Description | Suitable When |
|---|---|---|
| Simplex Lattice | Regular grid of mixtures over the simplex | All combinations are equally spaced |
| Simplex Centroid | Uses all pure blends, midpoints, and overall centroid | Useful for main effect estimation |
| Constrained Mixture | Boundaries or ratios are imposed on component levels | For formulations with min/max limits |
| D-Optimal Mixture | Custom design optimised for model terms | For irregular or costly experiments |
🧮 4. When the Response is a Function of Proportions
The canonical mixture model is:

Where:
,
- Only cross-product terms appear — there are no
terms because of the constraint
🔁 5. When You Want to Optimise a Formulation
Mixture designs allow you to:
- Map the response surface over the mixture space
- Use contour plots to visualise optimal blend regions
- Apply desirability functions for multi-response optimisation
🚫 When Not to Use Mixture Designs
| Situation | Use Instead |
|---|---|
| Inputs are independent (not part of a mixture) | Use Factorial or RSM designs |
| Total amount, not proportion, affects response | Consider factorial with quantitative factors |
| Mixtures are nested within process variables | Use combined mixture-process designs |
| Categorical inputs are involved | Use mixture with categorical blocks or a hybrid approach |
🔁 Summary – Mixtures designs
Use mixture designs when:
- The inputs are proportions of components and must sum to 1
- You’re optimising a blend, recipe, or formulation
- Traditional DOE methods violate mixture constraints
- You need to model interactions between mixture components
- You want a structured, efficient way to explore the mixture space
✅ When Are Mixture Designs with Process Variables Used?
These designs are used when the final response depends on both:
- The composition of a mixture (e.g. percentages of ingredients)
- One or more external process settings (e.g. curing temperature, time, stirring speed)
They enable simultaneous optimisation of formulation and operating conditions.

🧪 1. When You Need to Optimise Both Formula and Process
Mixture-process designs let you quantify how process variables affect the performance of different blends.
- Example: A polymer adhesive is made from components A, B, and C, but its final bond strength also depends on curing temperature and pressure.
🔬 2. How the Design Structure Works
You define:
- Mixture components x1,x2,…,xqx_1, x_2, \dots, x_qx1,x2,…,xq, such that:
- Process variables z1,z2,…,zpz_1, z_2, \dots, z_pz1,z2,…,zp which are unconstrained.

The model may include:
- Mixture terms:
- Process terms:
- Interaction terms:
, i.e. mixture-by-process interactions


🧮 3. Typical Model Form

Where:
= process variables
= interaction terms capturing how process variables influence each mixture component
📊 4. Common Use Cases
| Application Area | Mixture Components | Process Variables |
|---|---|---|
| Food technology | Ingredients (e.g. flour, fat, sugar) | Baking temperature, time |
| Pharmaceuticals | Active & excipient mix | Granulation speed, humidity |
| Polymer formulation | Resins, fillers, hardeners | Curing pressure, heat rate |
| Coatings | Solvent blend | Spray rate, ambient conditions |
📈 5. Design Options
Designs can be built as:
- Combined Mixture-Process Designs (crossed designs)
- Split-plot Designs (when process variables are harder to change)
- Custom Designs (D-Optimal) for irregular regions or constraints
Design software like Design-Expert, JMP, and MODDE support these complex layouts.
🚫 When Not to Use Mixture-Process Designs
| Situation | Better Approach |
|---|---|
| Only mixture composition matters | Use standard Mixture Design |
| Only process variables matter | Use RSM (e.g., Central Composite Design) |
| Too many variables for available runs | Use screening designs first |
| Process variables are categorical | Use blocking or mixed-model approaches |
🔁 Summary – Mixtures designs with process variables
Use mixture designs with process variables when:
- The response is influenced by both formulation and process conditions
- You want to optimise both simultaneously
- You’re exploring interactions between composition and operating settings
- Standard mixture or RSM designs are too limited for your system
👥 Who Uses DoE and Why
Design of Experiments (DoE) is used by professionals and researchers across many disciplines who need to understand, improve, or optimise a process, product, or system. Here’s a breakdown of who uses DoE and why:
🧑🔬 1. Engineers
- Mechanical, Electrical, Chemical, and Civil Engineers
- Use DoE to:
- Optimise design parameters
- Improve product performance
- Identify critical tolerances
- Reduce failure rates
- Example: A mechanical engineer tests combinations of material thickness and heat treatment temperature to maximise fatigue strength.
🏭 2. Manufacturing & Process Engineers
- Use DoE to:
- Minimise scrap and defects
- Improve process yield and cycle time
- Reduce variability and cost
- Example: A production line engineer designs an experiment to find the best combination of curing time, pressure, and temperature for moulded parts.
⚗️ 3. Scientists & Researchers
- Fields: Chemistry, Biology, Materials Science, Environmental Science, etc.
- Use DoE to:
- Plan efficient laboratory experiments
- Explore interactions between multiple reagents or conditions
- Optimise reactions or processes
- Example: A chemist uses DoE to find the optimal catalyst concentration, pH, and reaction time for maximum yield.
🔬 4. Quality Professionals
- Roles: Quality Engineers, Six Sigma Black Belts, QA/QC Analysts
- Use DoE to:
- Identify root causes of defects
- Improve product reliability
- Implement robust processes
- Example: A Six Sigma project team uses a factorial design to investigate the cause of variation in product dimensions.
💊 5. Pharmaceutical & Medical Device Developers
- Use DoE to:
- Validate manufacturing processes (per FDA or EMA guidelines)
- Optimise drug formulations
- Ensure consistent product performance
- Example: A pharmaceutical company uses response surface methodology (RSM) to optimise tablet disintegration time.
📊 6. Data Scientists & Statisticians
- Use DoE to:
- Structure controlled testing environments
- Create interpretable models with experimental data
- Support data-driven decisions
- Example: A statistician applies DoE to an A/B/n test involving different interface layouts in software development.
🚗 7. Automotive & Aerospace Developers
- Use DoE to:
- Tune control systems
- Reduce NVH (noise, vibration, harshness)
- Develop lightweight, high-strength structures
- Example: An aerospace design team tests wing structures with different rib spacing and material layups for maximum stiffness-to-weight ratio.
🧪 8. Food, Cosmetics, and Consumer Product Scientists
- Use DoE to:
- Optimise sensory qualities and shelf life
- Improve formulation stability
- Reduce costs without compromising quality
- Example: A food technologist designs a mixture experiment to balance taste, texture, and nutrition in a new product.
🎯 Summary Table – Users of DoE
| User Type | Typical Goal | Example |
|---|---|---|
| Engineer | Optimise product or system performance | Maximise heat exchanger efficiency |
| Manufacturer | Improve process efficiency and quality | Reduce defect rate in casting |
| Scientist | Run informative experiments efficiently | Maximise enzyme yield |
| Quality Professional | Reduce variation, ensure compliance | Root cause analysis in Six Sigma |
| Pharma/Medical | Validate processes, optimise formulations | Minimise dissolution time |
| Data Scientist | Structure controlled testing | Website feature testing |
| Aerospace/Auto | Improve reliability and weight | Optimise crash resistance |
| Consumer Product Dev | Improve sensory and stability properties | Optimise lotion formulation |
💻Which Software Should I Use for DoE?
There are several software platforms available for planning, conducting, recording, and analysing Design of Experiments (DoE). These range from specialist statistical tools to more general-purpose data science platforms, and their capabilities vary depending on the depth of analysis and regulatory needs.
✅ 1. Specialist DoE Software (Purpose-Built)
These tools are specifically designed for experimental design and analysis:
🧪 Design-Expert (Stat-Ease)
- Strengths: Comprehensive DoE capabilities including factorial, response surface, mixture, Taguchi, and robust designs.
- Features:
- Graphical interface for planning
- Powerful diagnostics (ANOVA, residuals)
- Contour and 3D surface plots
- Best for: Engineers and scientists focused solely on experimentation.
- OS: Windows
- Website: www.statease.com
📊 JMP (SAS Institute)
- Strengths: Visual, interactive analysis environment with deep statistical tools.
- Features:
- Drag-and-drop DoE planning
- Interactive dashboards
- Data exploration and modelling
- Best for: R&D and Six Sigma teams needing visual exploration.
- OS: Windows and Mac
- Website: www.jmp.com
🧬 Minitab
- Strengths: Widely used in quality engineering and Six Sigma.
- Features:
- DoE wizard
- Built-in templates for factorial, Taguchi, and RSM
- Extensive statistical tests and control charts
- Best for: Quality improvement professionals.
- OS: Windows (with web version)
- Website: www.minitab.com
🧰 2. General Data Science Platforms (With DoE Plugins/Scripting)
These are more flexible but require scripting or setup:
🐍 Python (via libraries like pyDOE, statsmodels, scikit-learn)
- Strengths: Open-source and scriptable.
- Use Cases:
- Generate design matrices (full/fractional factorials, central composite, Latin hypercube)
- Analyse via regression or ANOVA
- Automate result plotting (e.g. with
matplotliborplotly)
- Best for: Developers and technical engineers comfortable with code.
- Limitations: No GUI; steep learning curve for non-programmers.
🟨 R (via DoE.base, rsm, FrF2)
- Strengths: Rich in statistical depth and free to use.
- Use Cases:
- All classical and modern experimental designs
- Sophisticated model fitting and diagnostics
- Publication-quality graphs
- Best for: Statisticians and academic researchers.
📊 Excel (with add-ins like XLSTAT, QI Macros, or JMP Add-In)
- Strengths: Ubiquitous and familiar.
- Use Cases:
- Basic factorial designs
- Taguchi L4–L32 orthogonal arrays
- Simple ANOVA and trend analysis
- Best for: Beginners or teams without specialist software.
📁 3. Enterprise & Regulatory Platforms
Used in regulated industries like pharmaceuticals and medtech.
💊 MODDE (Sartorius)
- Strengths: Targeted for QbD (Quality by Design) in pharma and biotech.
- Features:
- Process understanding & DoE
- Regulatory compliance (FDA/EMA)
- Data visualisation
- Best for: Regulated industries requiring validated tools.
📦 Fusion QbD / DryLab
- Strengths: Focused on chromatography and formulation optimisation.
- Best for: Analytical chemists and regulatory R&D.
🧮 Summary Table – DoE Software
| Software | DoE Design | Analysis | Visualisation | Best For |
|---|---|---|---|---|
| Design-Expert | ✓✓✓ | ✓✓✓ | ✓✓ | Engineers, R&D |
| JMP | ✓✓✓ | ✓✓✓ | ✓✓✓ | Visual analysts, R&D |
| Minitab | ✓✓ | ✓✓✓ | ✓✓ | Quality teams |
| Python | ✓✓✓ | ✓✓✓ | ✓✓✓ | Programmers, automation |
| R | ✓✓✓ | ✓✓✓ | ✓✓✓ | Statisticians |
| Excel (+Add-ins) | ✓ | ✓ | ✓ | Beginners |
| MODDE | ✓✓✓ | ✓✓✓ | ✓✓ | Pharma, biotech |
| Fusion QbD | ✓✓ | ✓✓ | ✓✓ | Analytical chemists |
One response to “Design of Experiments explained”
[…] For a more detailed overview of experimental design see: Experimental Design. […]