Following the release of our Mixtures DoE Tool, Product Development Engineers Ltd has launched its second subscriber tool — an extension that combines mixture design with process variable optimisation. Subscribers can access the tool here. Where the Mixtures tool focuses on ingredient proportions alone, this tool is for situations where the formulation interacts with how it is made or processed. You read about our pure Mixtures tool here. At $10 per month, or only $39 per year, our DoE subscription represents real value, and with more tools to come at these same all-inclusive prices! You can subscribe to our DoE tools here.
What It Adds
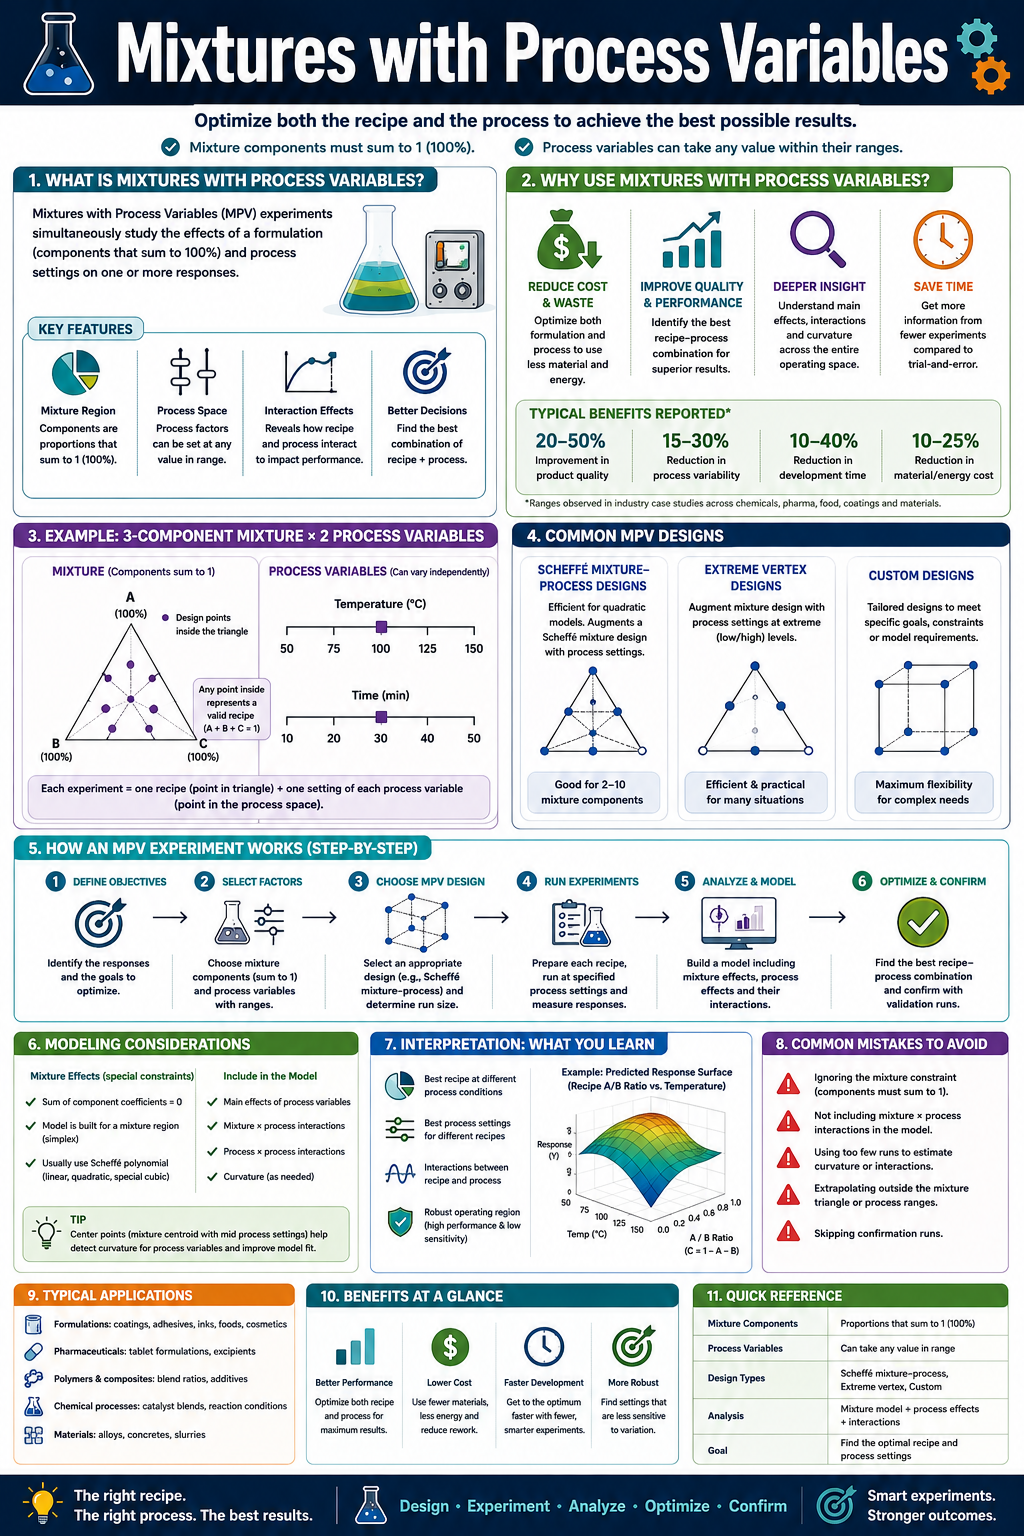
Users who are familiar with our Mixtures tool will recognise the same 10-step workflow. The additional capability lies in the definition of one or more process variables — parameters such as temperature, processing time, pressure, or pH — which sit alongside the mixture components and are varied simultaneously across the experimental design.
Process Variable Definition
After defining mixture components, users specify between one and five process variables, each with two or five discrete levels. The tool constructs a combined design that spans both the mixture space and the process variable space, generating a single integrated run sheet.

Extended Model Types
The mixture model types are the same as those in the Mixtures tool — Linear, Quadratic, Special Cubic, and Full Cubic — but users additionally select a model scope that controls how process variables enter the model. The three scope options are: Scheffé only (process variables ignored, useful for comparison), Scheffé plus PV main effects (an additive model where mixture and process variable effects are independent), and Scheffé multiplied by PV (a full interaction model where each mixture term is crossed with each process variable term). The two selectors are chosen independently, giving a wide range of model structures to suit the complexity of the system under study.
Additional Visualisations
Three plot types are added beyond those available in the Mixtures tool. The PV Main Effects plot shows the marginal effect of each process variable on the response across its range, with mixture composition held constant.

The Mix×PV Interaction plot draws separate Cox trace lines for a selected mixture component at each level of a selected process variable, making it easy to see whether the importance of a component changes with processing conditions.

The PV Surface plot shows predicted response as a function of process variable settings at a fixed mixture blend — as a 2D line when one process variable is active, or a 3D surface when two are varied simultaneously.

Optimisation
The optimiser works across both spaces simultaneously, identifying the combination of mixture proportions and process variable settings that maximises, minimises, or hits a target for each response. Multiple responses can be handled using the same desirability framework as the Mixtures tool.
Export
Run sheets and HTML reports include process variable columns alongside mixture component columns, with all additional model terms, interaction plots, and process variable visualisations incorporated into the export.
As with the Mixtures tool, validation testing has been performed against published benchmarks and synthetically generated datasets.